Not just the industry standard "switch-port mapper" - IGRID is not the standard switch-port mapper tool you find on so many websites. Yes, it lists all the interfaces on your router and gives you status, IP Address and MAC Layer information, but it gives you so much more about the underlying technologies on your interfaces. In addition you can live monitor the bandwidth utilization of each interface.
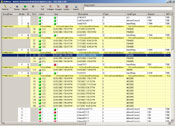
Interface Layout like never before! Get an instant inventory of all physical and logical interfaces! Delve into the interface representation on the device. See which interfaces are operationally and administratively up and down. Administer interfaces via SNMP. Dig deeper from the interface configuration layers into the individual interface's statistics using the OiDViEW Data Window.
Not just for interfaces anymore. Just about anything with a MIB and an SNMP agent can be modeled and administered by OiDViEW's iGRID. The default iGRID profile for any new session is IF-MIB, but feel free to create custom iGRID profiles using our XML interface and iGRID schema.
All layers can be represented! Finally, iGRID ends the navigational nightmare of combing through provision files, telnet sessions, configuration files, and manual MIB variable queries, by supporting automatic discovery of sub-interfaces and sub-layers. Which paths are defined on that ATM port? Which ATM channels are on those ATM paths? iGRID determines how these discrete logical entities are setup, and shows them in a format which is easy to understand and even easier to use. There are no limits to the number of sub-layers that can be defined (i.e. ATM Port-> ATM Path-> ATM Channel, etc). Collapse and Expand layers at will.
|
 | | iGRID Screenshot |
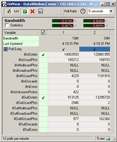
OiDViEW Data Window - Easily Drill-Down from the interface or sub-interface level into a data window which contains a pre-defined set of statistics (these can be altered in the XML profile). These statistics can be collected at almost any interval ranging from a timed poll of 1 poll per minute down to a poll every second. See which values are NULL or behaving strangely. Launch the Performance Module and log, graph, even trace PDUs for a specific variable. Collect like statistics for like interfaces in the same data window. Have ultimate control by turning polling ON or OFF for each individual interface, and even each individual variable.
 | | Datawindow Screenshot |
|
The following iGRID profiles are currently supported and come installed with OiDViEW. More are being supported all the time. If you have a request for one that is not on this list (or a modification for a supported profile that you think we should incorporate into the existing support), submit a support request.
| Supported Technologies |
MIBS |
|
|
| ATM (Asynchronous Transfer Mode) |
ATM-MIB |
| DOCSIS (Data over Cable IF-MIB) |
DOCS-IF-MIB |
| DS (Digital Services) |
DS-1 |
| Ethernet DOT-3 |
DOT3-MIB |
| Ethernet RMON |
RMON-MIB |
| Frame Relay |
FRAME-RELAY-DTE-MIB |
| MIB2 Interfaces |
IF-MIB |
| SONET (Synchronous Optical Network) |
SONET-MIB |
| Routing / Switching / Bridging |
BRIDGE-MIB
IP-MIB / IP-FORWARD-MIB
IP-NET-TO-MEDIA-MIB |
|
|
|
|
|
|
|